.svg)



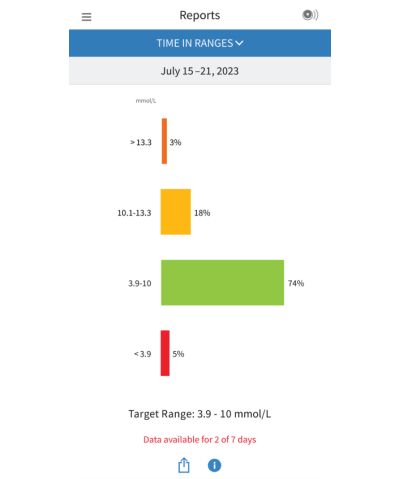
/connecting_the_data/time_in_ranges.png)

Triangle of Diabetes Care
⏱ 5 minutes read
Stay in control by tracking the three pillars of diabetes care with the FreeStyle Libre systems.*
Get quick and easy access to our support team.
ADC-109888 v1.0






GB Mainland: 3 day delivery
Northern Ireland: 3-4 day delivery
(Estimated standard delivery)

All payments are secure and encrypted

Your cart is empty
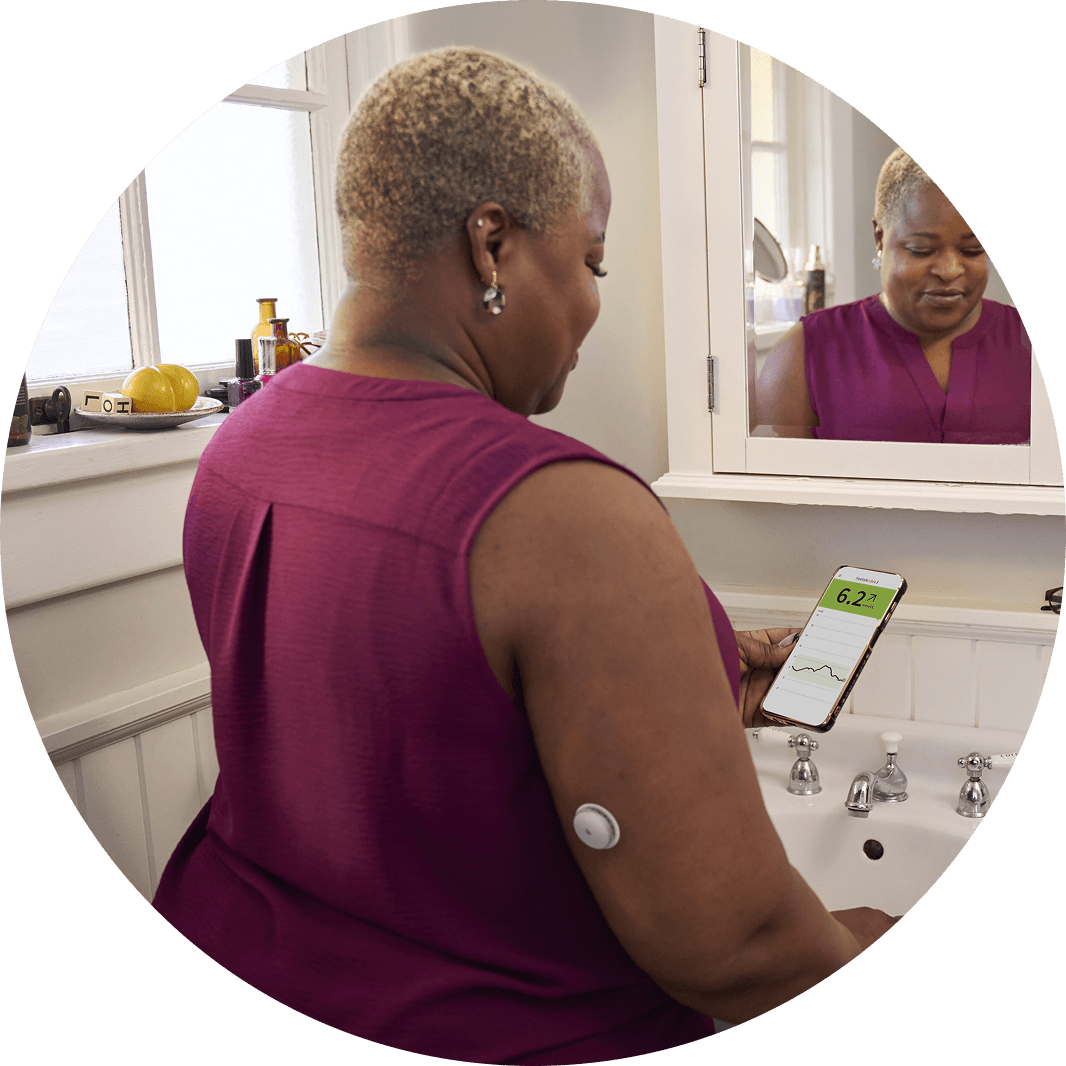
/connecting_the_data/connecting_the_data_header_desktop.png)
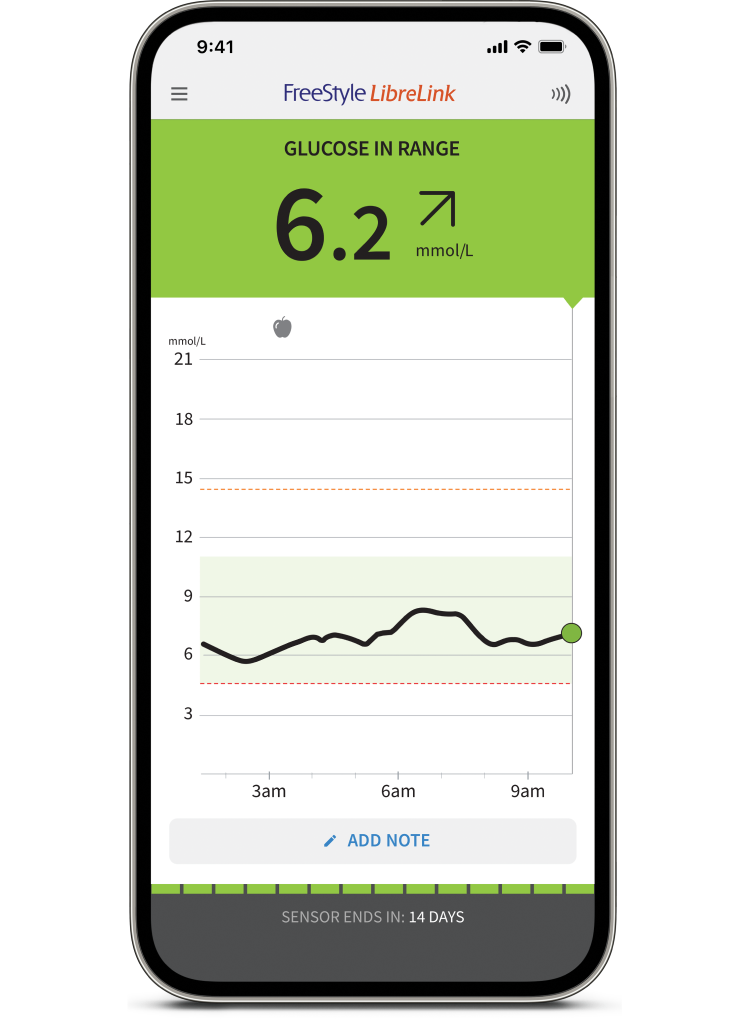
Your LibreLink or Libre 3 app's home screen is your go-to place for quickly accessing your most recent glucose data. On your home screen, you’ll see:
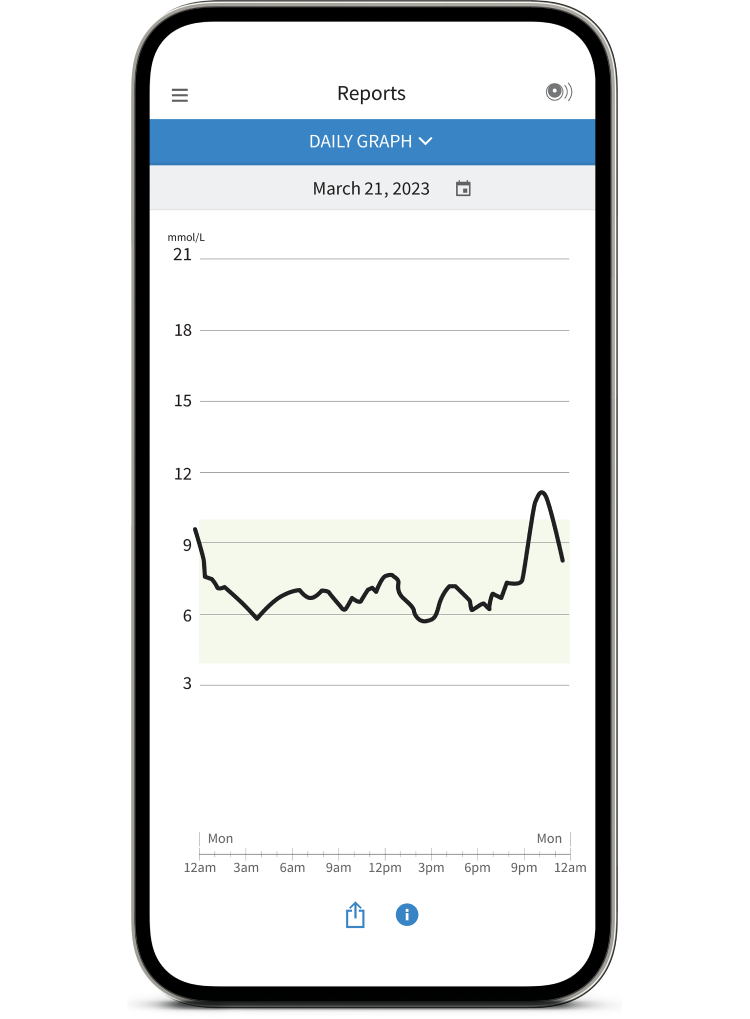
Once you’re used to accessing and reading the information on your home screen, you can navigate to the Daily Graph. To find the Daily Graph, click on the menu in the top left and find the Daily Graph tab under Reports.
Your Daily Graph shows your glucose over a period of time, helping you see broader patterns.
After five days of collecting data, your FreeStyle Libre 2 system or FreeStyle Libre 3 system will have more data you can use to get historical glucose data.
To access your Reports, click on the menu in the top left and find the Reports section.
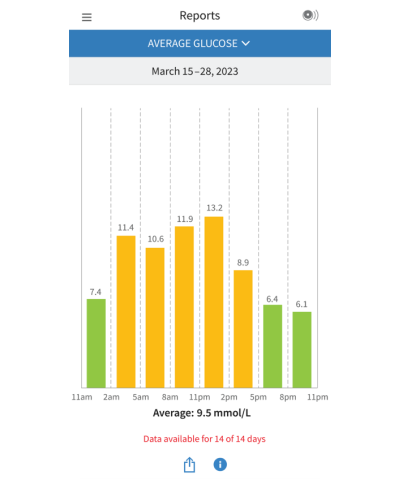
See the overall average of your sensor readings—plus how those averages shift throughout the day.
Your main average appears at the top. Below, see how your levels tend to look in the morning, afternoon, evening, and overnight.
The colours help you read your averages at a glance:
Green means you’re in range.
Yellow, orange, or red show times when your glucose moved above or below your target.
/connecting_the_data/average_glucose.png)
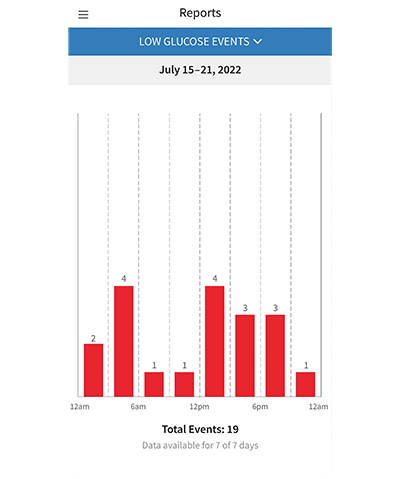
The Low Glucose Events chart displays times when your glucose dropped below your set levels over a period of time.
/connecting_the_data/low_glucose_events.png)
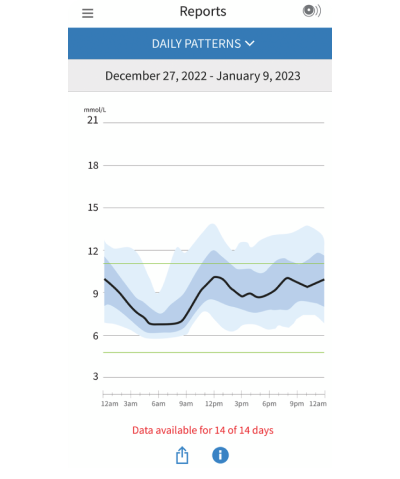
Your Daily Patterns graph helps you see the rhythm of your glucose throughout a typical day. Here’s how to read it:
The thick line shows the midpoint of your readings — your day’s "centre line.”
The inner shaded band shows where most of your readings land.
/connecting_the_data/daily_patterns.png)
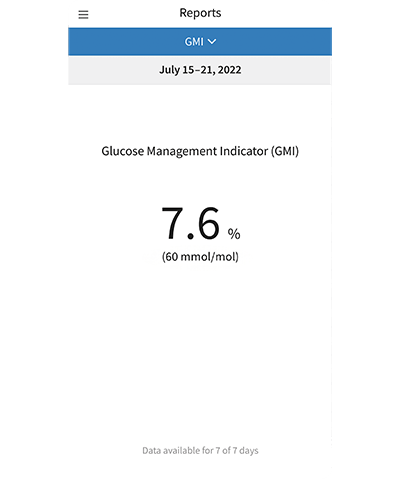
Your Glucose Management Indicator (GMI) gives you an estimate of what your HbA1c might look like based on your average sensor glucose.
It uses your day-to-day readings to show how steady your levels have been over time. Think of it as a snapshot of how your overall glucose management is trending.
The percentage you see reflects that estimate—and helps you track your long-term progress.
/connecting_the_data/gmi2.png)

You wake up, check your LibreLink app, Libre 3 app, or the Libre 2 or Libre 3 reader, and see your glucose at 6.3 mmol/L and rising. That trend arrow tells you something’s shifting. Maybe it’s stress, a late-night snack, or just your morning routine.
What it could mean: This is your cue to pause and consider small adjustments, like timing your insulin or breakfast differently.

You finish your usual loop and suddenly feel shaky or sweaty. You check your LibreLink app, Libre 3 app, or your Libre 2 or Libre 3 reader, and your glucose is reading low.
What it could mean: This is a sign to bring your glucose levels back up, and to make sure you have a snack or meal before your next bout of movement.
The longer you use your FreeStyle Libre 2 system or FreeStyle Libre 3 system, the more your data reveals about what works best for your glucose. You’ll start to see how one choice today shapes how you feel tomorrow.

/connecting_the_data/woman-looking-at-data.png)
Take a moment each week to look at your GMI, and try setting a new goal for yourself with the help of your healthcare provider or healthcare team. Goal setting is a way to measure your progress and watch how you overcome challenges. You’ve got this.
⏱ 5 minutes read
Stay in control by tracking the three pillars of diabetes care with the FreeStyle Libre systems.*

⏱ 4 minutes read
Explore what makes a balanced meal and what goes into creating one.
The “Yes” link below will take you to a website other than Abbott Laboratories. Links pointing you to other websites are not under the control of Abbott Laboratories, and Abbott Laboratories is not responsible for the content of such websites or other links contained on such website. Abbott Laboratories provides these links only as a courtesy and the inclusion of any link does not imply endorsement by Abbott Laboratories of the site.
Do you want to leave this page?
FreeStyle.abbott/uk-en is a product specific website only intended for residents of the United Kingdom. If you live in another country, please contact your local Abbott office to obtain the correct product information for your country of residence.

