What you need to know.
Applying your new sensor is a lot easier than you might think – and it doesn’t require painful finger pricks10. So, why wait another moment? Let’s get started.
- Preparing your skin
- Applying the sensor
- Activating the sensor with your device
- Removing and replacing the sensor
To begin, select an area on the back of your upper arm and follow these steps:

Step 1
Select site on back of upper arm.

Step 2
Wash site using plain soap and water, then towel dry.

Step 3
Clean the area with an alcohol wipe and air dry.
Once you’ve prepared the back of your upper arm, apply the sensor using either the two-piece or the one-piece applicator.

Step 1
Place the sensor applicator over the prepared site and push down firmly.

Step 2
The sensor should now be attached to your skin.

Step 3
Secure by pressing down gently with your finger around the edge.
Once your sensor is applied, you need to pair it with your app12 or reader.
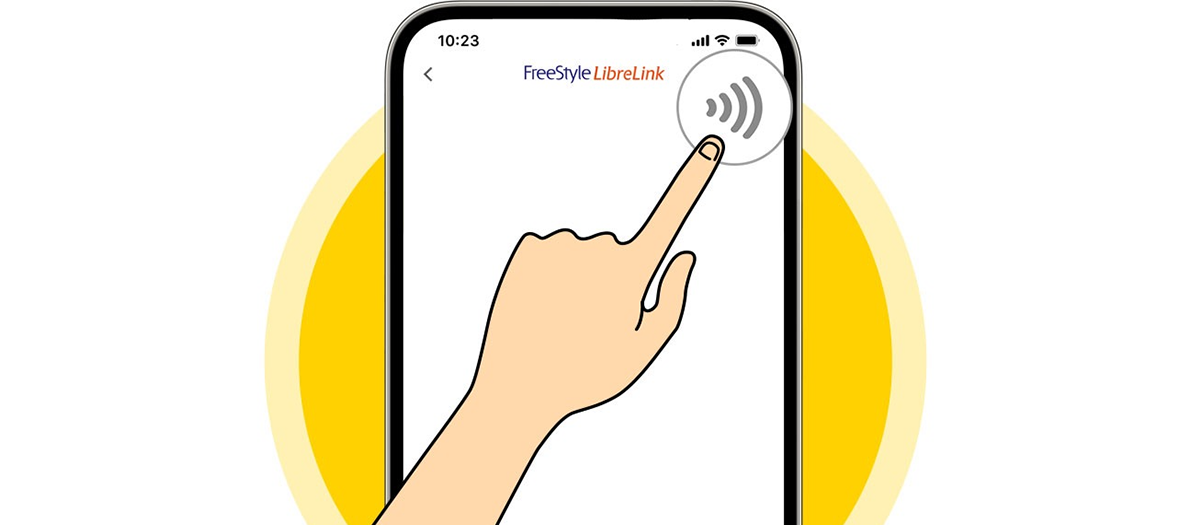
Step 1
Press “Scan New Sensor” on your app12 or reader.

Step 2
Hold your device near the sensor and slowly scan it.

Step 3
You will hear a beep or feel a vibration upon activation.

Step 4
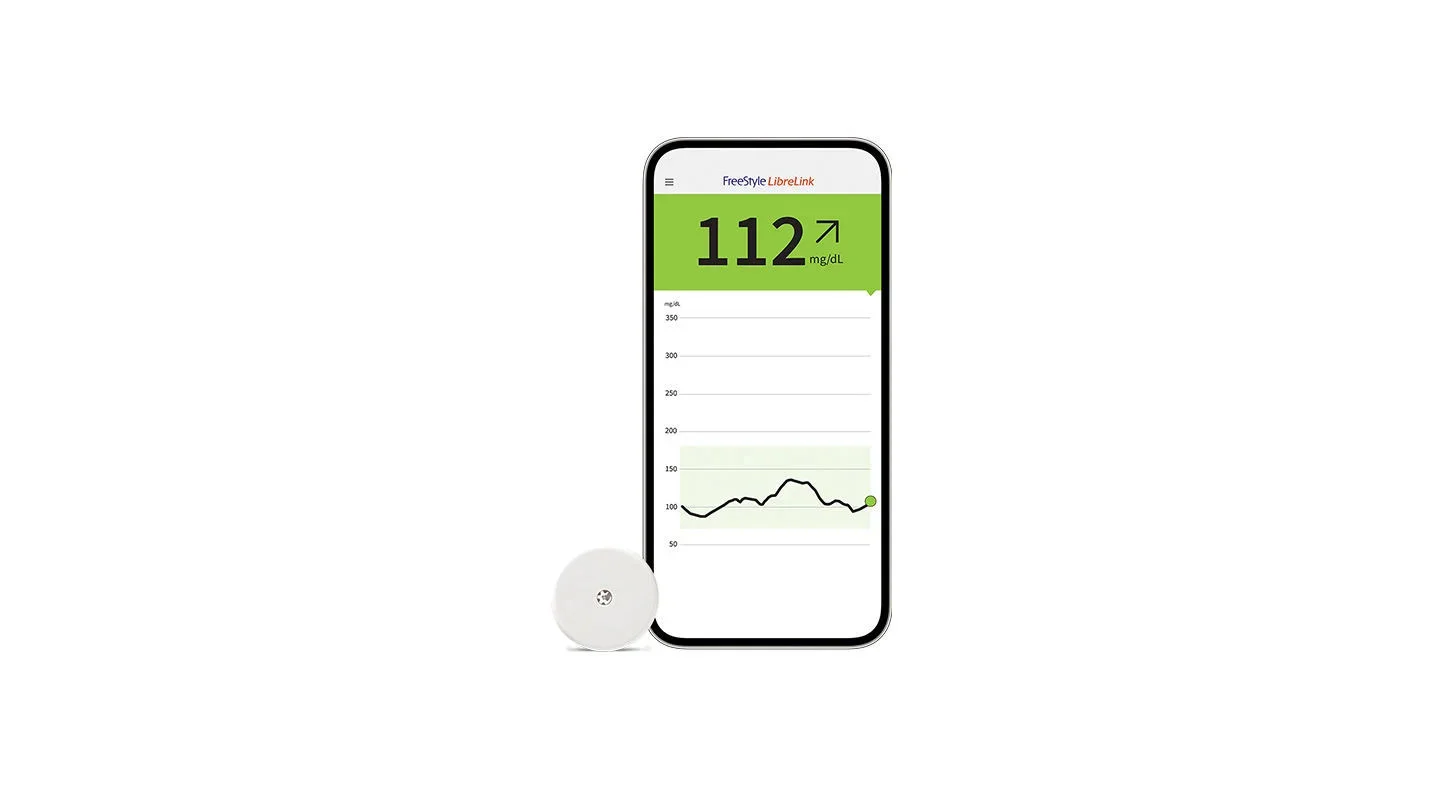
The sensor can be used to check your glucose after 60 minutes.
Your device will alert you when it’s time to replace your sensor. To remove it:
Step 1
Pull up the adhesive edge, then slowly peel it off the skin.

Step 2
A soft moisturizer can make it easier to remove.
Step 3
Discard the used sensor and apply the new one as you did before.
To begin, select an area on the back of your upper arm and follow these steps:
Step 1
Select site on back of upper arm.
Step 2
Wash site using plain soap and water, then towel dry.
Step 3
Clean the area with an alcohol wipe and air dry.
Once you’ve prepared the back of your upper arm, apply the sensor using either the two-piece or the one-piece applicator.
Step 1
Place the sensor applicator over the prepared site and push down firmly.
Step 2
The sensor should now be attached to your skin.
Step 3
Secure by pressing down gently with your finger around the edge.
Once your sensor is applied, you need to pair it with your app12 or reader.
Step 1
Press “Scan New Sensor” on your app12 or reader.
Step 2
Hold your device near the sensor and slowly scan it.
Step 3
You will hear a beep or feel a vibration upon activation.
Step 4
The sensor can be used to check your glucose after 60 minutes.
Your device will alert you when it’s time to replace your sensor. To remove it:
Step 1
Pull up the adhesive edge, then slowly peel it off the skin.
Step 2
A soft moisturizer can make it easier to remove.
Step 3
Discard the used sensor and apply the new one as you did before.
View video for full details.
You may also download these
helpful guides for more information.
helpful guides for more information.
Diabetes is a
balancing act.
We can help.
Are you currently using FreeStyle Libre or starting your first sensor and looking to learn more about managing your glucose and diabetes? Sign up for the MyFreeStyle program and get helpful insights on how food and exercise affect glucose levels, advice for tracking your progress, and much more.

You might also like:


Every glucose reading tells a story.
FreeStyle Libre systems give you a complete picture17 of where your glucose is and where it’s headed so you can see what affects your glucose levels.

Here for you.
At every step.
We want you to live life freely – without any barriers. So, if you have questions, or need further support, all you need to do is ask.
ADC-104486 v2.0