

Understanding your FreeStyle Libre systems data
Once you’ve connected your sensor to your smartphone, you’ll gain insights into what affects your glucose levels. Here’s some handy information that explains what you’ll see.

Use the data on your FreeStyle LibreLink App12 to see how you’re progressing over time.
- Real-time glucose information
- Time In Range
- Trend Arrows
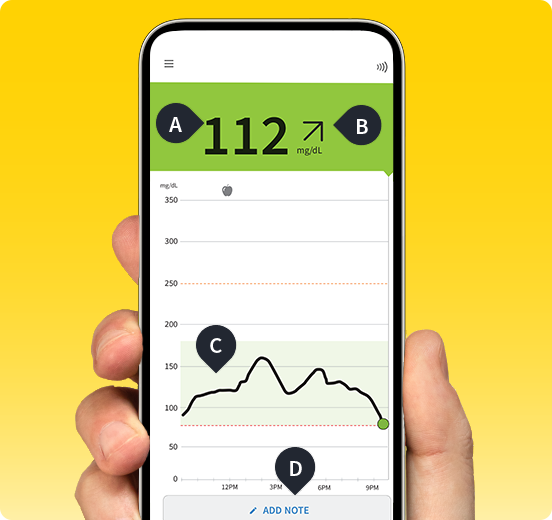
Monitor trends and patterns from your device to see how well you’ve been managing your glucose over time.
-
Current glucose reading
Measured every minute, and the color lets you know if you’re in range.
-
Trend arrow
Indicates the direction your glucose is heading and how quickly it’s rising or falling.
-
Glucose history
Continuous glucose graph shows how your levels have changed over the last 12 hours.
-
Add note –
Track food, insulin use, exercise, and other events.
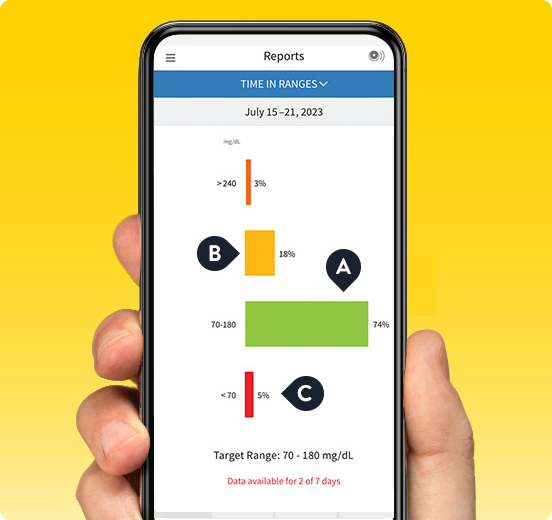
Track your progress over time to see how much time you’ve spent in or out of range.
-
Target Glucose Range
The more time you spend here, the better your A1c.
-
Above Target Glucose Range
Shows when your glucose was too high so you can pinpoint what may have caused it to spike.
-
Below Target Glucose Range
Shows when your glucose was too low so you can pinpoint what may have caused it to dip.
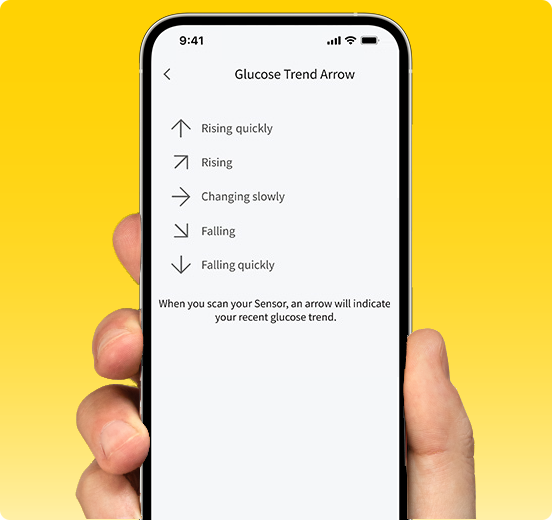
Know where your glucose is headed.
The arrows indicate the direction of your glucose readings, helping you interpret them more easily, and to respond as needed.
Monitor trends and patterns from your device to see how well you’ve been managing your glucose over time.
-
Current glucose reading
Measured every minute, and the color lets you know if you’re in range.
-
Trend arrow
Indicates the direction your glucose is heading and how quickly it’s rising or falling.
-
Glucose history
Continuous glucose graph shows how your levels have changed over the last 12 hours.
-
Add note –
Track food, insulin use, exercise, and other events.
Track your progress over time to see how much time you’ve spent in or out of range.
-
Target Glucose Range
The more time you spend here, the better your A1c.
-
Above Target Glucose Range
Shows when your glucose was too high so you can pinpoint what may have caused it to spike.
-
Below Target Glucose Range
Shows when your glucose was too low so you can pinpoint what may have caused it to dip.
Know where your glucose is headed.
The arrows indicate the direction of your glucose readings, helping you interpret them more easily, and to respond as needed.
View video for full
details.
You may also download these helpful guides for more information.
Why don’t blood glucose and sensor readings match?
Glucose enters the blood first,this is what finger prick glucose tests measure32. Then, it enters the interstitial fluid (ISF) found around cells beneath the skin –this is what continuous glucose monitoring sensors measure32. Both are accurate but at slightly different points in time.
Think of blood glucose as the engine of a train, and the interstitial fluid or sensor glucose as the caboose32.
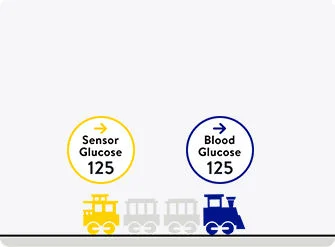
Stable glucose levels
When glucose levels are stable, there’s little difference in measurements.
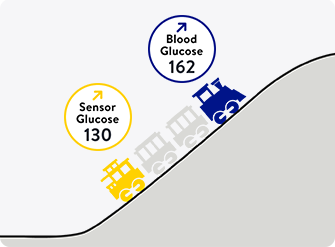
Climbing glucose levels
As glucose levels rise, like they can after a meal, sensor glucose lags behind blood glucose32.
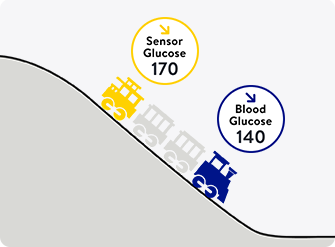
Dropping glucose levels
After medication or exercise, glucose levels may fall with sensor glucose again lagging behind32.

Diabetes is a
balancing act.
We can help.
Are you currently using FreeStyle Libre or starting your first sensor and looking to learn more about managing your glucose and diabetes? Sign up for the MyFreeStyle program and get helpful insights on how food and exercise affect glucose levels, advice for tracking your progress, and much more.

You might also like:



Here for you.
At every step.
We want you to live life freely – without any barriers. So, if you have questions, or need further support, all you need to do is ask.
ADC-104498 v1.0