


Creating, printing and saving reports
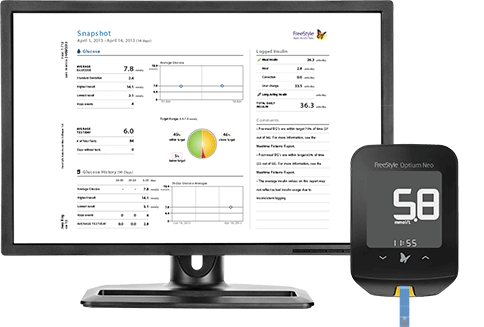
FreeStyle Auto-
Assist Neo Software
Easy-to-use software to help you and your Healthcare Team manage your FreeStyle Optium Neo Blood Glucose and Ketone Monitoring System.
Getting Started

Report Overview
FreeStyle Auto-Assist Neo Software includes six reports.
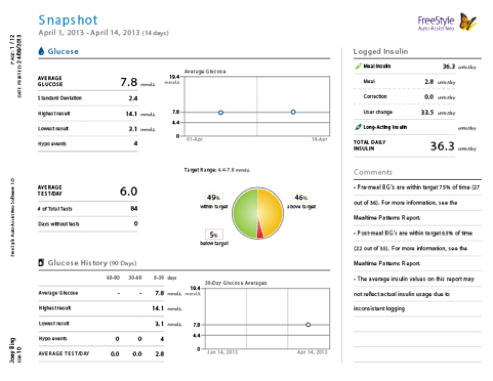
Snapshot
The Snapshot Report provides a data summary for a specified date range, including up to six notes relating to important blood glucose trends.
Modal Day
The Modal Day Report shows the daily pattern of blood glucose results over a specified date range along with average total insulin doses, type of insulin used (basal or rapid-acting).

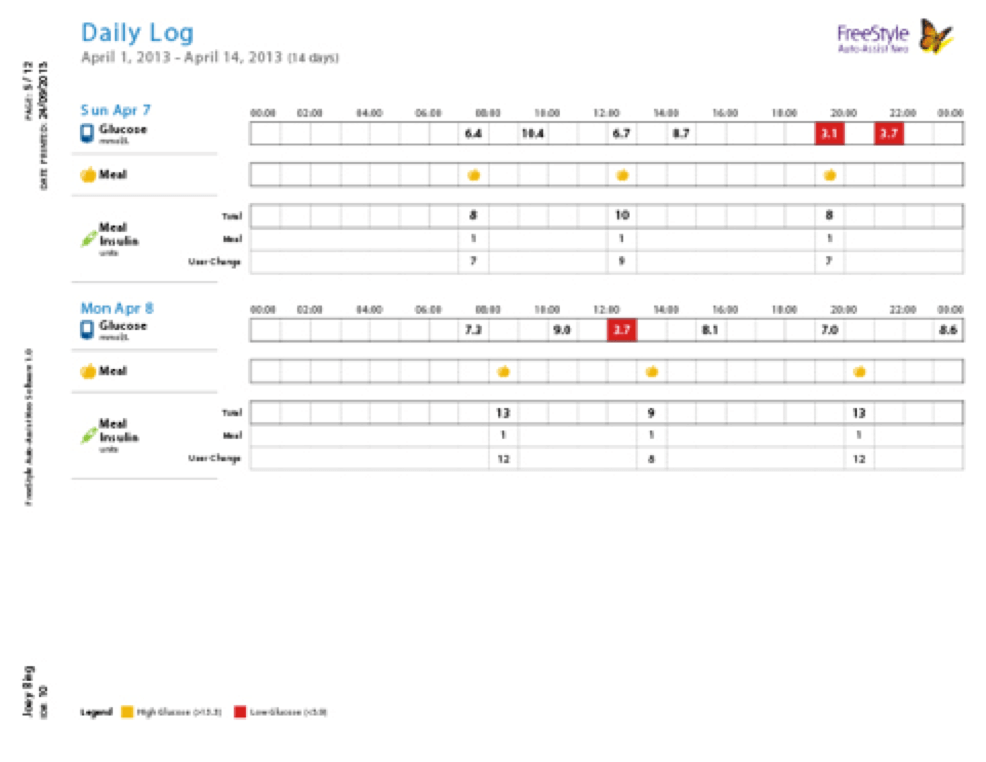
Daily Log
The Daily Log provides a table of blood glucose readings, results and other values, such as ketone test results and logged insulin doses for each day in a specified date range.
Insulin doses are only available if logged in the meter.
Basel Titration
The Basal Titration report compares fasting blood glucose levels with long-acting insulin doses over a 12-week period. The report also shows when long-acting insulin doses have been adjusted based on fasting blood glucose trends.

Mealtime Patterns
The Mealtime Patterns Report compares the before-meal and after-meal blood glucose levels for breakfast, lunch and dinner, over the specified date range. This report also shows before-and-after meal averages and logged insulin.

Dose Plan
The Dose Plan shows you the current meter setup along with the history of settings for spot check therapy and confirmation programming. Insulin settings are displayed visually to reinforce how the patient finds their dose on the meter.

How to use the software


References & Disclaimers
Images are for illustrative purposes only. Not real patient or data.
ADC-57014 v2.0
