

FreeStyle Libre system.
Helping people with diabetes reach their goals27
Checking your glucose used to mean pricking your fingers a lot. Not anymore. The FreeStyle Libre system continuously tracks your glucose using a small, 14-day sensor.


Join the more than 7 million people who use FreeStyle Libre systems worldwide1.
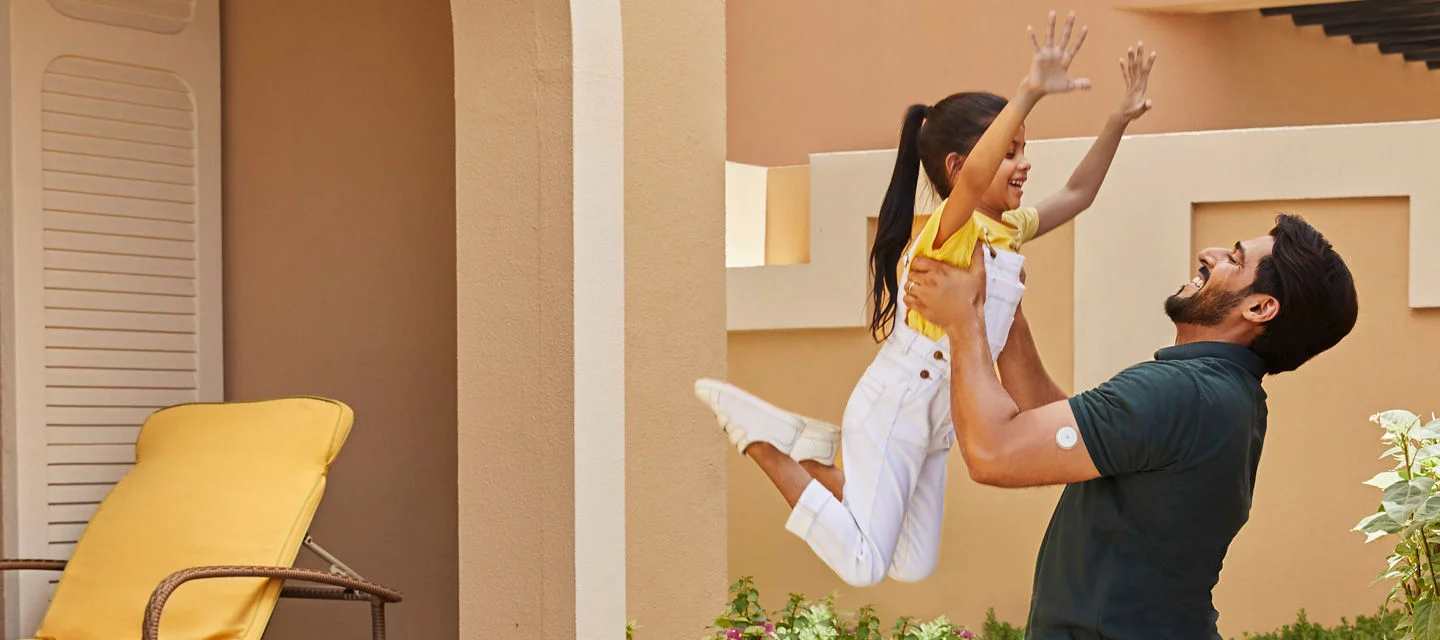
Diabetes is a
balancing act.
We can help.
Are you currently using FreeStyle Libre or starting your first sensor and looking to learn more about managing your glucose and diabetes? Sign up for the MyFreeStyle program and get helpful insights on how food and exercise affect glucose levels, advice for tracking your progress, and much more.

Get the most from your
FreeStyle LibreLink app12.
Use it to connect with caregivers.
Learn more about LibreLinkUp21
Use it to share26 with healthcare providers.
Learn more about LibreView24
Download your FreeStyle LibreLink app12 and get started.


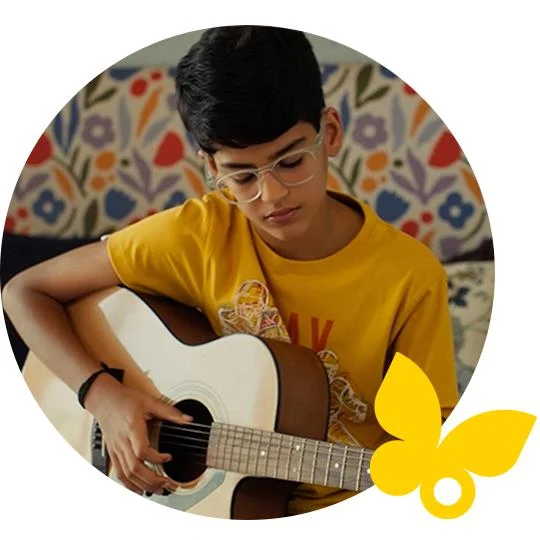
Learn from others who have been there.

"With Freestyle Libre, I can now monitor my glucose levels even in school to help me predict hypoglycemic events and share the readings with my parents. This allows me to play all the games I love without having to worry anymore."

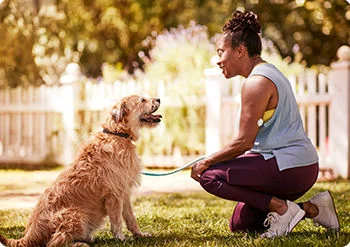
"Earlier, I didn't have the energy to walk up a flight of stairs. With FreeStyle Libre, I can track and share my glucose levels, avoid low glucose and manage my energy levels. The best part is that my parents worry less."
Compare Sensors.
Use our comparison chart to see which sensor is right for you.
| How long can I wear it? |
15 days |
14 days |
|---|---|---|
| How small is it? |
5mm in height and 35 mm in diameter |
5mm in height and 35 mm in diameter |
| What age is eligible for use? |
Age 2 and over |
Age 4 and over |
| What alarms can I set? |
|
None |
| What is the Bluetooth range? |
6 meters |
6 meters |
| How is sensor data sent? |
Streamed with the FreeStyle LibreLink smartphone app or scanned with a reader |
Scan with FreeStyle LibreLink smartphone app or reader |
| How long is data stored? |
8 hours |
8 hours |

You might also like:

Diabetes is a balancing act. We can help.
Are you currently using FreeStyle Libre or starting your first sensor and looking to learn more about managing your glucose and diabetes?

Every glucose reading tells a story.
FreeStyle Libre systems give you a complete picture17 of where your glucose is and where it’s headed so you can see what affects your glucose levels.
ADC-104484 v1.0