

Understanding your FreeStyle Libre 2 Plus systems data
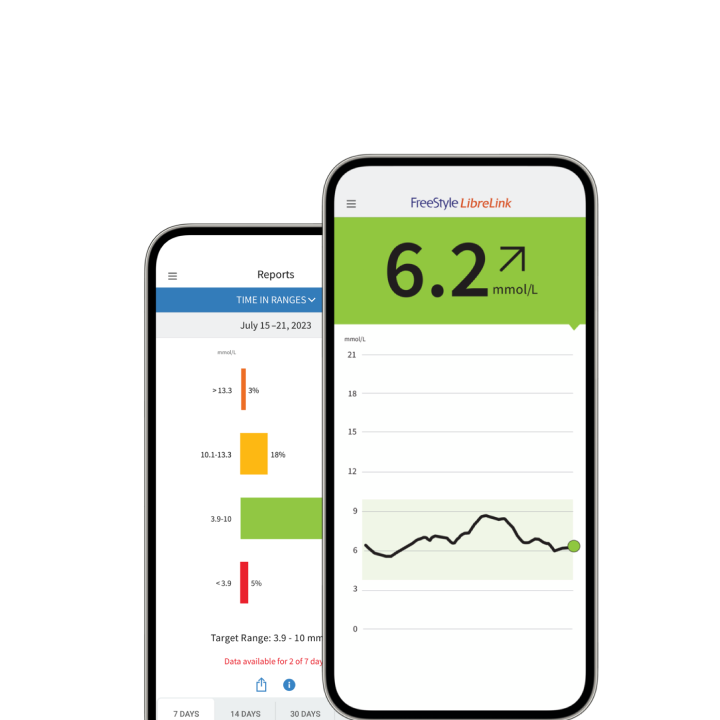
Use the data on your LibreLink app13 to see how you're progressing over time.
- Real-time glucose information
- Time In Range
- Trend Arrows
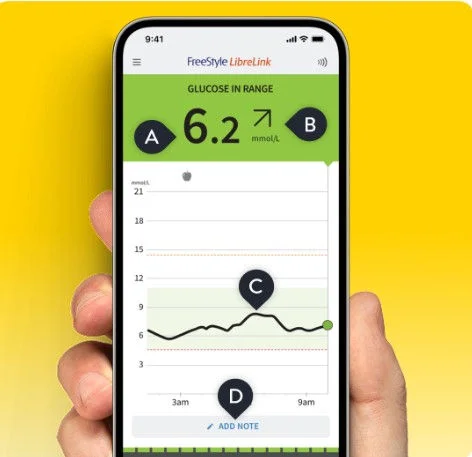
Monitor trends and patterns from your device to see how well you’ve been managing your glucose over time.
-
Current glucose reading
Measured every minute, and the color lets you know if you’re in range300
-
Trend arrow
Indicates the direction your glucose is heading and how quickly it’s rising or falling.
-
Glucose history
Continuous glucose graph shows how your levels have changed over the last 8 or 12 hours.
-
Add note
Track food, insulin use, exercise, and other events.
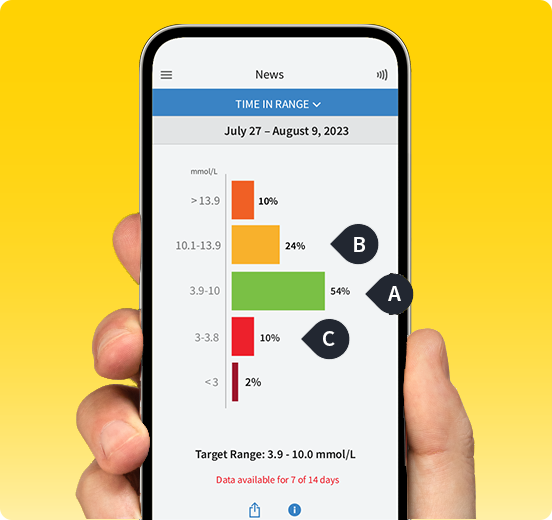
Track your progress over time to see how much time you've spent in or out of range.
-
Target Glucose Range
The more time you spend here, the better your A1c306.
-
Above Target Glucose Range
Shows when your glucose was too high so you can pinpoint what may have caused it to spike.
-
Below Target Glucose Range
Shows when your glucose was too low so you can pinpoint what may have caused it to dip.
You may not always be within your target range300, but knowing what it is can help you better understand how food, activities, and medications can impact your glucose8.
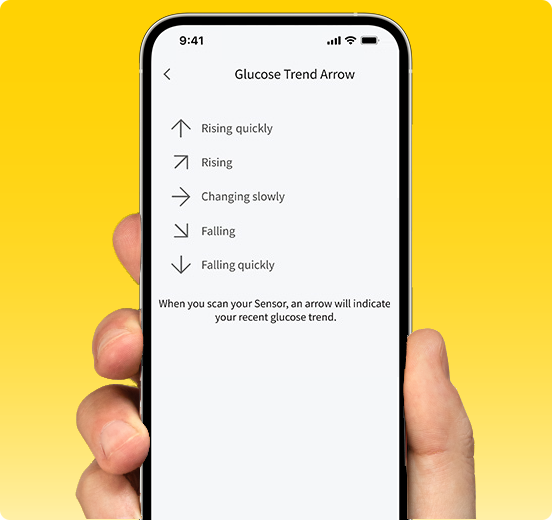
Know where your glucose is headed.
The arrows indicate the direction of your glucose readings, helping you interpret them more easily, and to respond as needed.
Monitor trends and patterns from your device to see how well you’ve been managing your glucose over time.
-
Current glucose reading
Measured every minute, and the color lets you know if you’re in range300
-
Trend arrow
Indicates the direction your glucose is heading and how quickly it’s rising or falling.
-
Glucose history
Continuous glucose graph shows how your levels have changed over the last 8 or 12 hours.
-
Add note
Track food, insulin use, exercise, and other events.
Track your progress over time to see how much time you've spent in or out of range.
-
Target Glucose Range
The more time you spend here, the better your A1c306.
-
Above Target Glucose Range
Shows when your glucose was too high so you can pinpoint what may have caused it to spike.
-
Below Target Glucose Range
Shows when your glucose was too low so you can pinpoint what may have caused it to dip.
You may not always be within your target range300, but knowing what it is can help you better understand how food, activities, and medications can impact your glucose8.
Know where your glucose is headed.
The arrows indicate the direction of your glucose readings, helping you interpret them more easily, and to respond as needed.
View video for full details.
Why don’t blood glucose and sensor glucose readings match?
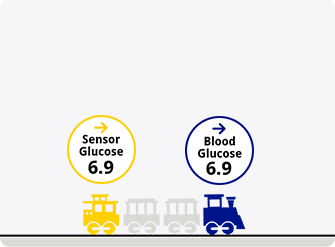
When glucose levels are stable, there’s little difference in measurements.
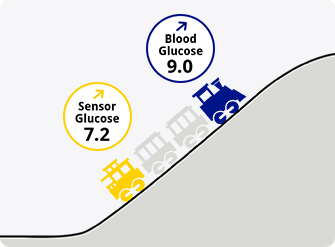
As glucose levels rise, like they can after a meal, sensor glucose lags behind blood glucose32.
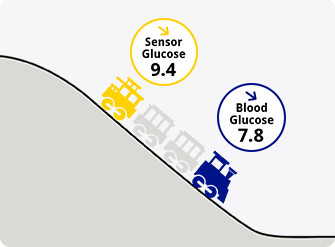
After medication or exercise, glucose levels may fall with sensor glucose again lagging behind32.

Helping you progress is part of the program.
As a member of Libre Care, we will keep you informed about important information designed to enhance your Libre experience.

You might also like: